As a Liverpool fan, perhaps the absolute last person you expect to do you a favour in a title challenge, is Roy Hodgson. His managerial ability is ranked by Liverpool supporters as being somewhere between Tim Sherwood and an actual photo of Hodgson posing with his dream signings of Poulsen & Konchesky. *shudders*
Those who endured his 6 month managerial spell at the club somehow managed to lose 6 years of their lives. Somehow. At least half of that just from watching the seconds tick by as Poulsen attempted to turn with the ball.
So, understandably, news that Roy Hodgson took all 3 points from their trip to the Etihad has been met with disbelief. Which, in turn, begun speculation about what complete breakdown at City had brought this about. The assumption being that something cataclysmic at City to bring about this unimaginable event. After all, this is a man who managed just one away win in his time at Liverpool. ONE!
This has all raised the following questions on football twitter, which we will attempt to answer here:-
- Were City just unlucky?
- Why are City struggling at the moment?
- Is it a personnel problem, or lack thereof due to injury?
- Have they been found out?
City were just unlucky, right?
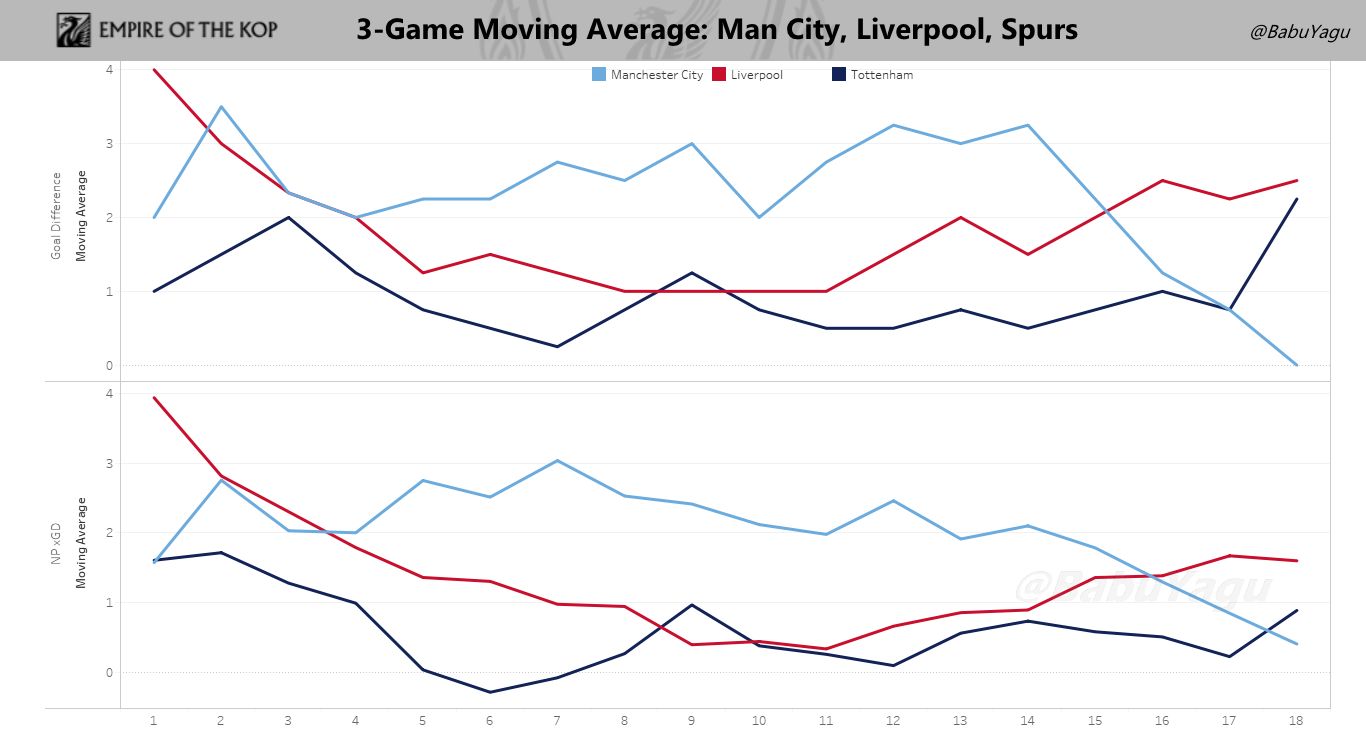
The above graph shows us the trending goal difference and Expected Goals Difference according to Expected Goals models. Try to think of goal difference as a measure of results – what actually happened. Therefore, expected goal difference is a measure of performances – what should happen based on chances created.
As you can see, performances have, by and large, matched results this season for all three teams. This actually makes a lot of sense from a coaching point of view where results are seen as a by-product of performances. We cannot directly control results, only performances, with coaching.
Which means, when City were blowing sides away, it was with merit. They have been trending as +2 goals better than sides they have faced all season long. However, this sudden sharp decline in results is matched on the performances graph. They haven’t been unlucky, performances have just stunk lately. But why?
Why are City struggling at the moment?
The first thing we need to do is breakdown the above numbers into expected goals for (xG) and expected goals against (xGA). This will help us see if their problems are in attack, defence, or both.
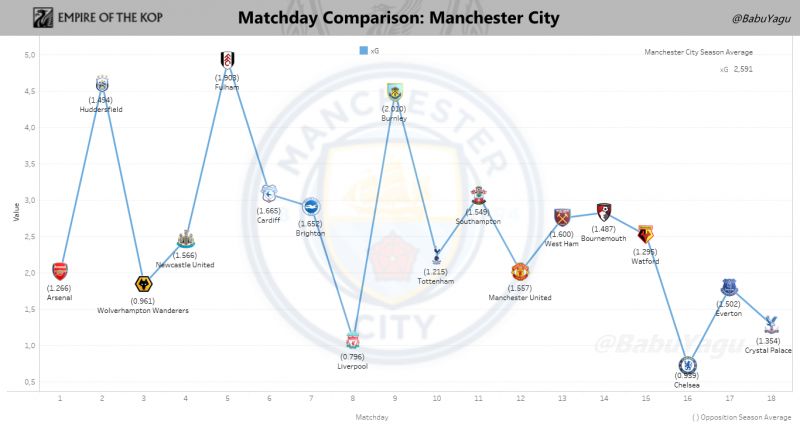
Looking at this graph, there seems a clear downward trend when comparing the right half of the graph with the left. However, it is possible this is due to the opponents they faced.
Looking at the average xGA for each side (in brackets below their badge), the sides faced in first 9 games have given up an average of 1.479 xGA per match this season. Manchester City had an average of 3.045 xG over those 9 games – outperforming the average by a whopping 106%.
Whereas in games 10-18, the sides faced in have given up an average of 1.389 xGA per match this season. Across those games, Manchester City had an average of 2.138 xG – outperforming the average by 54%.
So while the opponents on the right have been slightly tougher, we are talking a difference of around 6% compared to a drop of almost 50% in performances. This suggests there is a lot more to this than simply the difficulty of opponents.
In which games has their attack struggled most?
What is most interesting to note though, it that Manchester City have failed to create chances worth xG 2.0 or more on 5 occasions this season.
Game 3 – Wolves (drew)
Game 8 – Liverpool (drew)
Game 16 – Chelsea (lost)
Game 17 – Everton (won)
Game 18 – Palace (lost)
3 of those 5 were in their last 3 games.
4 of the 5 they dropped points.
The worry for Guardiola will be that Manchester City are needing to be creating xG 2+ per game otherwise they likely drop points. That isn’t sustainable every game.
The bigger worry would be that they are now in a run of 3 consecutive less than 2.0 xG games that they need to escape from.
Are their struggles limited to their attack?
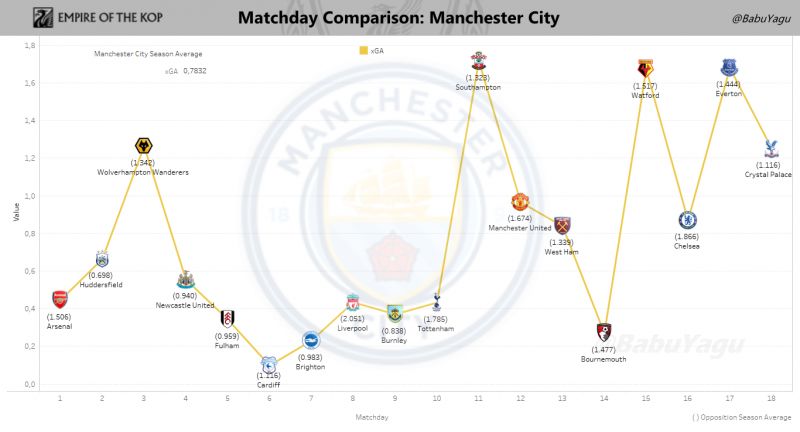
Graph says no. Their struggles are definitely not limited to just their attack.
Their problems in terms of shutting out sides actually looks a lot more pronounced compared to those in attack.
Their xGA only crept above the 0.8 line once in their first 10 games of the season; Wolves (again). An average of 0.48 xGA per game.
However, since then, 7 out of the 8 games they have played have had an xGA above 0.8. This includes the defeats to both Chelsea & Palace. An average of 1.16 xGA per game.
Is it a personnel problem, or lack thereof, due to injury?
Well, Kevin De Bruyne has effectively missed the whole season so far. However, he made a scoring return at the weekend. While he is a world class player, we are assessing ‘what changed’ when looking at the dip this season. Therefore, we have to exclude him as the situation has been the same both before, and after, the dip.
So let’s look at the players who have been involved for City this season for at least 1/3rd of the minutes played (or 540 minutes).
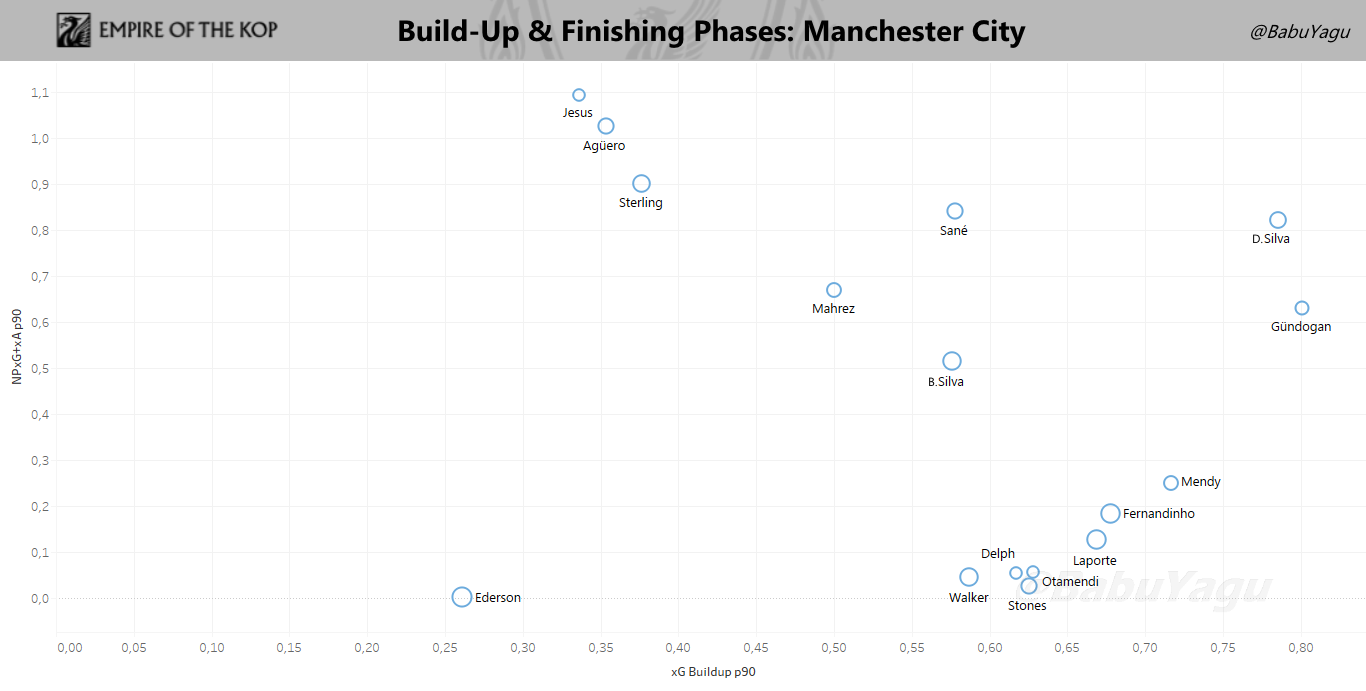
If you treat height on the graph as importance in the final 3rd, this would suggest that Jesus, Agüero, Sterling, Sané & D.Silva are their five most important players in the final 3rd. This suggests that their attacking output should be high when any 3 from 4 of those attacking players is involved. There also isn’t too much of a drop in quality to Mahrez either; their record signing.
A player’s width on the graph indicates their involvement in the teams build-up play. Here we can see the stand-out players in this regard are D.Silva & Gundogan with Mendy, Fernandinho and Laporte all being important also.
Were any of these key players missing for their poor attacking performances?
Now let’s look again at the 5 games above where City fell below xG 2.0 to see which, if any, of these key players missed the game.
Game 3 – Wolves –Sané & Jesus involved off the bench.
Game 8 – Liverpool – Gundogan absent through injury. Sané & Jesus involved off the bench.
Game 16 – Chelsea – Mendy & Agüero absent through injury. Gundogan & Jesus involved off the bench.
Game 17 – Everton – Silva & Mendy absent through injury. Agüero unused sub (wasn’t needed?). Sterling & De Bruyne involved off the bench.
Game 18 – Palace – Fernandinho, Silva & Mendy absent through injury. Agüero & De Bruyne involved off the bench.
So, in all the games, bar Wolves, they have started with a front three from Agüero, Jesus, Sterling, Sané & Mahrez. Perhaps more importantly, in 4 of the 5 games, they were missing one of Gundogan or D.Silva from the starting XI. De Bruyne’s return will likely help with this problem.
However, it looks like the Palace game was something of a perfect storm where they missed D.Silva, Mendy & Fernandinho. Stones, Delph & B.Silva were unable to maintain their high quality build-up play in their absence.
Have they been found out?
This is an expression I particularly dislike in relation to football.
It is typically used by people who have an overly-simplified view of the game. Secondly, there is nothing any opposition analyst that watches Manchester City will find surprising. There is no ‘light bulb’ moment.
Pep’s system is well established now from Barca to Bayern to Manchester City. Sure, the formation will change, but the roles on the pitch in possession are consistent, as is their tactical framework.
Pep is a world class coach and tactician. Perhaps one of the greatest in the history of the game. He has a squad at his disposal littered with world class players with others worth £50m+ on the bench providing depth. These are the things we know to be true.
What we don’t know, is how opposition managers assess the prospect of playing them and the tactical choices they will make. Including the most simple of all – will they allow City time on the ball, or space to exploit?
So has anything changed in their approach against City?
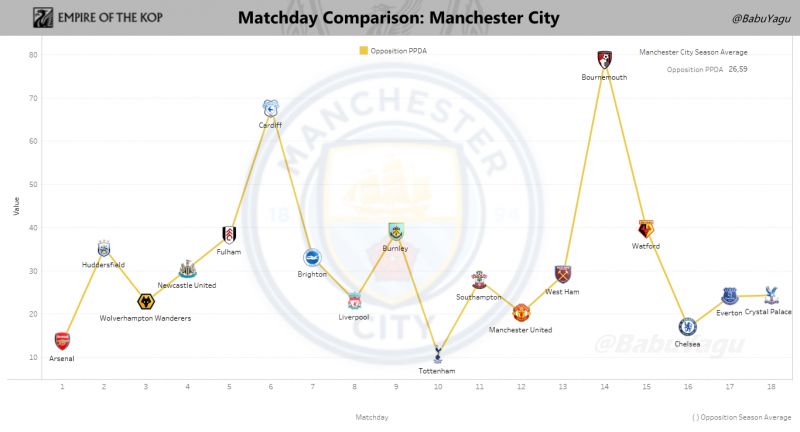
PPDA – or Passes Per Defensive Action – is a measure of how many passes your team is able to complete for every defensive action of the opponent, all in your own half of the pitch.
So, for example, Spurs are allowing Manchester City to complete a little over 10 passes, in their own half, per defensive action. This suggests they are working hardest/most efficiently to disrupt their passing of all opponents on the graph. They are trying to limit time on the ball.
Whereas Bournemouth allowed Manchester City to complete almost 80 passes per defensive action in their own half. This suggests they either didn’t engage City high up the pitch at all, or did so with poor efficiency and never got near them. They are most likely trying to limit space for City to exploit.
What we can see, is that all of the opponents who have taken points off of Manchester City this season have a PPDA of below 25. Whereas, all the sides above 25 lost; 8 of the 10 by at least 2 goals.
If we go back to when we looked at players who were absent, it seemed City struggled when key players to their build-up play were absent. This all suggests that the more their build-up play is disrupted either due to absences or opposition tactics, the more they may struggle.
In Summary
So while I don’t believe in the idea that Pep has been ‘found out’, it may be that sides like Wolves, Everton and Palace have accepted that sitting off City is effectively signing your own death warrant. Going after them in their own half is a huge risk in giving them space to exploit, but at least if gives you a fighting chance against them.
Of course, like every system, there are certain players in Pep’s system who may be lynch-pins for how they play. David Silva seems to be the conduit through which every attack runs through for City.
However, Fernandinho is equally important on and particularly off the ball for them. John Stones may be a good ball-playing centre half. However, that is with the whole pitch in front of him.
The main problem you face moving into a central midfield role is the need for 360o awareness, less time on the ball, and being pressed in your blind spot. In addition, Fernandinho is extremely tactically adept in that role in delaying counter attacks. He knows how to make himself hard to get around and will rarely get dribbled past – just 0.7 times on average per game. When that fails, he will eat a tactical foul – on average 1.6 times per game.
At the weekend, John Stones was dribbled past twice playing in the same position and didn’t commit a foul all game. You can’t help but feel the counter attack that moved right through his zone in the build-up to the Schlupp goal perhaps doesn’t happen with Fernandinho on the pitch.
Likewise, the ball that falls in that zone just outside the box to Townsend is also Fernandinho territory. John Stones had dropped deeper into an area to help the central defence more.
Perhaps the biggest problem though, is their key player in each line of their shape in midfield and attack is 30 or over and have already played a combined 5,000 minutes already this season.
